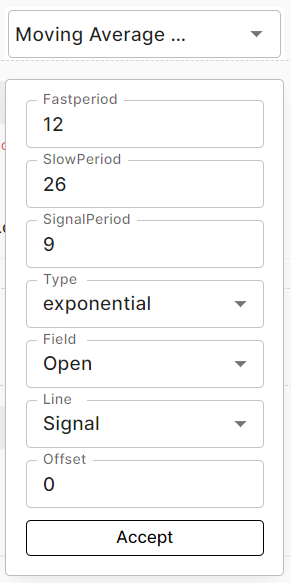
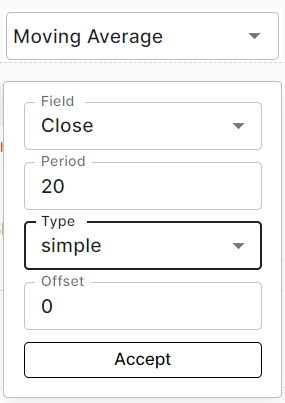
Moving Average
A moving average is a technical indicator that traders use to determine the direction of a trend. It sums up the data points of a traded instrument over a specific time period and divides the total by the number of data points to arrive at an average. It is called a “moving” average because it is continually recalculated based on the latest price data.
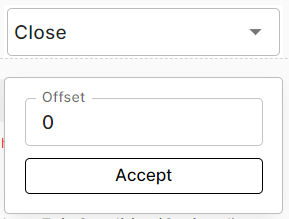
Close
Close is used to define the close price of the candle on a closing basis.
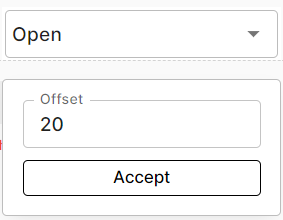
Open
Open is used to define the open price of the candle on a closing basis.
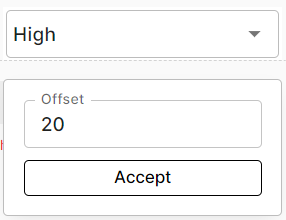
High
High is used to define the high price of the candle on a closing basis.
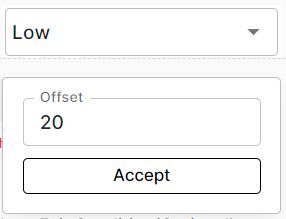
Low
Low is used to define the low price of the candle on a closing basis.
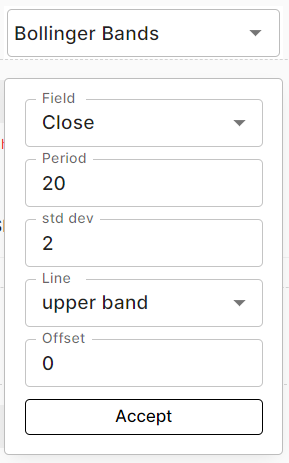
Bollinger Bands
Bollinger bands are price channel of 3 lines that are plotted above, below and along the price. The line in the middle is simple moving average line of period 20 which serves as a base for upper and lower bollinger band. Typically, upper and lower bands are set of two standard deviation away from the middle line.
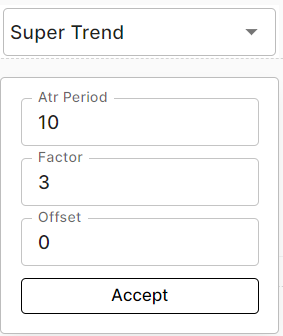
Super Trend
A Supertrend is a trend following indicator which is similar to moving averages. It is plotted on price, and its placement can define the current direction. This indicator is simple to use and is constructed with the help of two parameters, which are period and multiplier. The supertrend indicator gives buy and sell signal whenever the close price crosses above/below the supertrend line.
Relative Strength Index(RSI)
RSI is one of the most extensively used momentum oscillator. RSI is used to measure the velocity and magnitude to price movements. It figures out the overbought and oversold regions and hence one can trade based on the indicator movement.
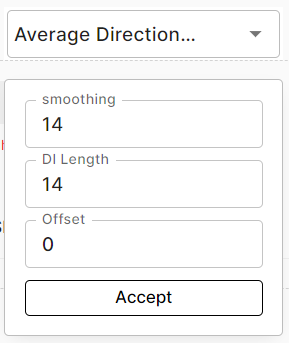
Average Directional Index
ADX reflects the expansion or contraction of the price range of a security. It usually measures how strong a trend is. The ADX gives you a reading that generally ranges between 0 and 50. The higher the reading, the stronger the trend. The lower the reading, the weaker the trend. ADX doesn't give any buy/sell signals rather it is used along with the other indicator to know the strength of the trend.
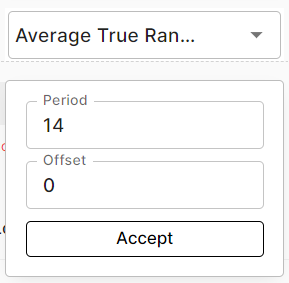
Average True Range
Average True Range (ATR) is an indicator that measures volatility. Average True Range (ATR) is the average of true ranges over the specified period. ATR measures volatility, taking into account any gaps in the price movement. Typically, the ATR calculation is based on 14 periods, which can be intraday, daily, weekly, or monthly.
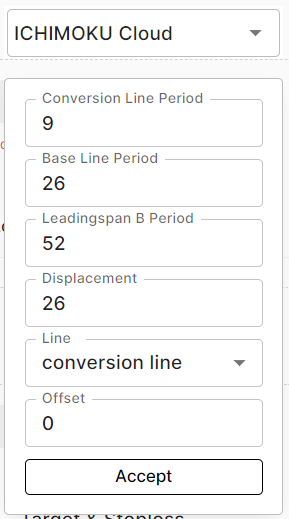
ICHIMOKU Cloud
The Ichimoku Cloud is a technical analysis indicator that defines support and resistance levels, gauges momentum and provides trading signals. The Ichimoku Cloud indicator is made up of five lines or ‘plots’:
The Tenkan-sen, known as the conversion line, is the nine-period high plus the nine-period low, divided by two. This is the midpoint of the 9-day high-low range, which means that the line spans just under two weeks.
The Kijun-sen, known as the base line, is the 26-period high plus the 26-period low, divided by two. This line is the midpoint of the 26-day high-low range
The Senkou Span A, known as the leading span A, is the conversion line plus the base line, divided by two. The leading span A marks the midpoint between the two lines, and forms the upper of the two cloud boundaries
The Senkou Span B, known as the leading span B, is the 52-period high plus the 52-period low, divided by two. As the midpoint of the 52-week range, this line plots just under three months and forms the lower cloud boundary
The Chikou Span, known as the lagging span, shows the closing levels plotted 26 days in the past
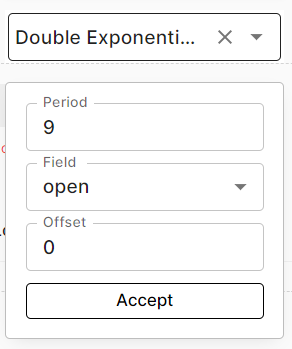
Double Exponential Moving Average
DEMA is an improvement over EMA because it allocates more weightage to recent data points and reduces the lag of EMA. It responds to the price movement much faster than EMA.
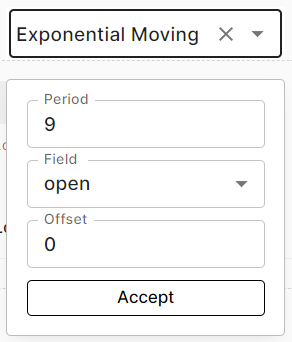
Exponential Moving Average
Unlike SMA, the EMA gives more weightage to the recent price movements. EMA responds faster to the rapid changes in the price movements. Usually EMA is used of shorter periods and fast moving price changes.
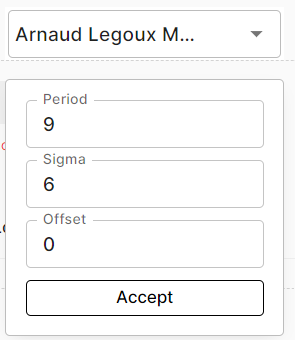
Arnaud Legoux Moving Average
The ALMA is a technical analysis tool that aims to give investors and traders a more reliable trading signal by reducing the noise that can interfere with traditional moving averages.
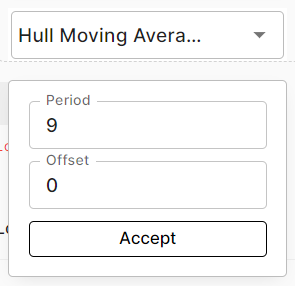
Hull Moving Average
The Hull Moving Average (HMA) is a directional trend indicator. It captures the current state of the market and uses recent price action to determine if conditions are bullish or bearish relative to historical data.
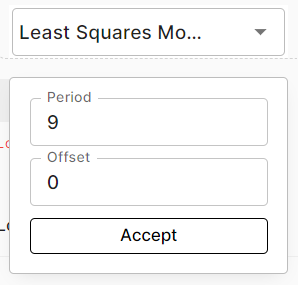
Least Squares Moving Average
The least square moving average (LSMA) calculates the least squares regression line for the preceding time periods, thus leading to forward projections from the current period. Accordingly, the indicator has the ability to identify what could happen if the regression line continued.
Moving Average Convergence Divergence
MACD is a trend following momentum indicator showing the difference between two moving averages. The MACD is calculated by subtracting the 26-period exponential moving average (EMA) from the 12-period EMA. It basically refines the two moving average systems and measures the distance between two moving average lines.
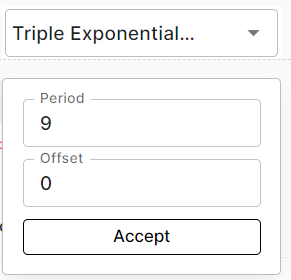
Triple Exponential Moving Average
The triple exponential moving average (TEMA) uses multiple EMA calculations and subtracts out the lag to create a trend following indicator that reacts quickly to price changes.
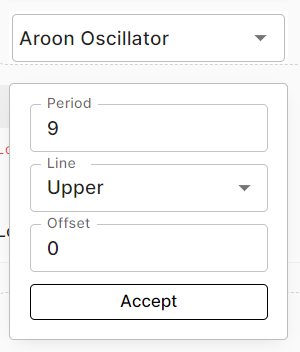
Aroon Oscillator
The Aroon Oscillator is the difference between Aroon-Up and Aroon-Down. This indicator fluctuates between -100 and +100 with zero as the middle line. An upward trend bias is present when the oscillator is positive, while a downward trend bias exists when the oscillator is negative.
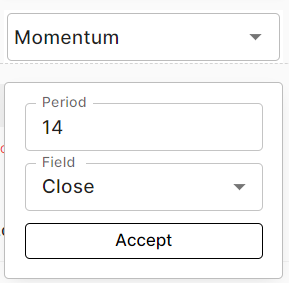
Momentum
A momentum indicator (oscillator) is a technical indicator which shows the trend direction and measures the pace of the price fluctuation by comparing current and past values. It is one of the leading indicators that measure the rate of change of securities. A momentum indicator is generally used in unison with other indicators.
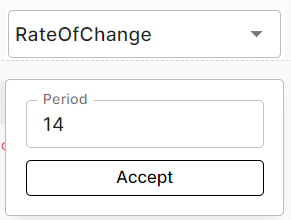
Rate Of Change
The Rate-of-Change (ROC) indicator, which is also referred to as simply Momentum, is a pure momentum oscillator. The ROC calculation compares the current price with the price "n" periods ago.
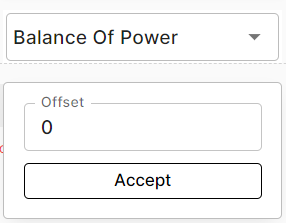
Balance Of Power
The Balance of Power (BOP) indicator measures a price trend by evaluating the strength of buy and sell signals, determining how strongly the price moves extreme high and low levels.
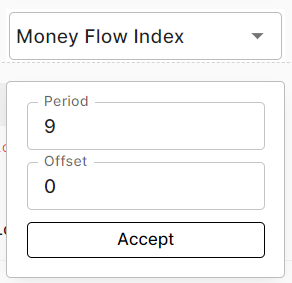
Money Flow Index
MFI is a momentum based oscillator used to identify overbought and oversold market conditions. It oscillates on a scale of 0 to 100. MFI looks at price and volume both to assess the buying and selling pressure in a given securtiy. The value of MFI above 80 is considered as overbought region and value below 20 is considered as oversold region.
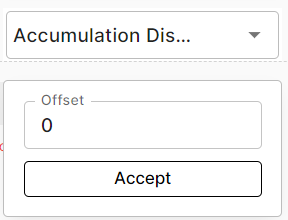
Accumulation Distribution
The accumulation distribution indicator (AD) or accumulation distribution line is a volume-based indicator used to determine the trend of a stock, using the relation between the stock’s price and volume flow. The term “accumulation” denotes the level of buying (demand), and “distribution” denotes the level of selling (supply) of a stock. Hence, based on the supply and demand pressure of a stock, one can predict the stock’s future price trend.
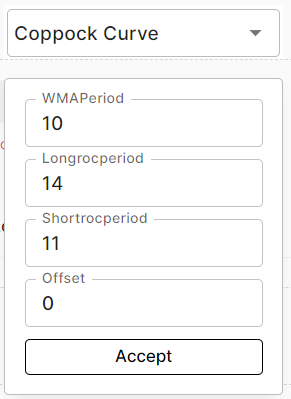
Coppock Curve
Coppock curve is a momentum indicator used to identify long term buy and sell signals. Coppock uses monthly data to identify buying opportunities when the indicator moves from negative territory to positive territory, Ideally coppock is not used for sell signals but one can consider a movement from positive territory to negative territory as a sell signal.
Commodity Channel Index
The Commodity Channel Index (CCI) is a technical indicator that measures the current price level relative to an average price level over a given period of time. The CCI fluctuates above and below zero. CCI is relatively high when prices are far above their average and CCI is relatively low when prices are far below their average.
Chande Momentum Oscillator
The CMO indicator is similar to the RSI indicator, but the RSI indicator is based on the speed of price action while the CMO indicator is based on closing price. The Chande Momentum Oscillator (CMO) indicator has values ranging between -100 on the lower end and +100 on the upper end. Overbought is when the value is 50+ and oversold is when the value is -50.
Donchian Channel
The Donchian channel is a trend-following indicator. It measures the high and the low of a previously defined range – typically of the past 20 days. A trader would look for a well-defined range and then wait for the price to break out to either one side for a trade entry trigger.
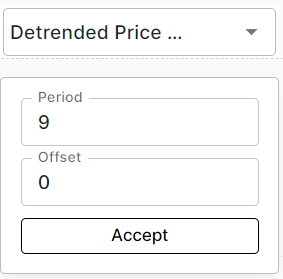
Detrended Price Oscillator
The Detrended Price Oscillator (DPO) is an indicator designed to remove trend from price and make it easier to identify cycles. DPO does not extend to the last date because it is based on a displaced moving average. However, alignment with the most recent date is not an issue because DPO is not a momentum oscillator. Instead, DPO is used to identify cycle highs/lows and estimate cycle length.
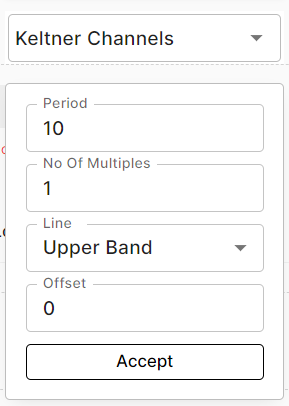
Keltner Channels
Keltner Channels are a combination of two other indicators: the exponential moving average (EMA) and the average true range (ATR). The moving average is the average price for a certain number of periods. The exponential variation gives a greater weighting to more recent prices and a lesser weighting to prices that aren't as recent.
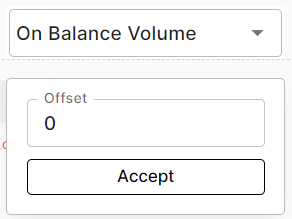
On-Balance Volume
On-balance volume (OBV) is a technical indicator of momentum, using volume changes to make price predictions. OBV shows crowd sentiment that can predict a bullish or bearish outcome.
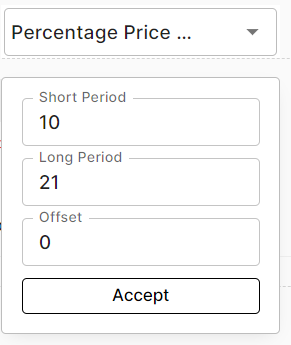
Percentage Price Oscillator
The percentage price oscillator (PPO) is a technical momentum indicator that shows the relationship between two moving averages in percentage terms. The moving averages are a 26-period and 12-period exponential moving average (EMA).
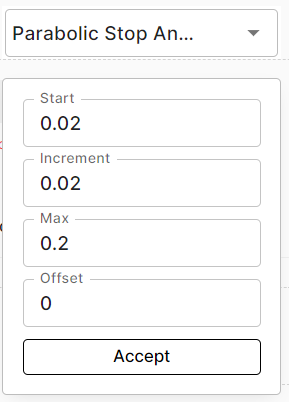
Parabolic Stop And Reverse
The parabolic stop and reverse, more commonly known as the "Parabolic SAR," or "PSAR" is a trend-following indicator. The parabolic SAR has three primary functions. First, it highlights the current price direction or trend. Second, it provides potential entry signals. Third, it provides potential exit signals.
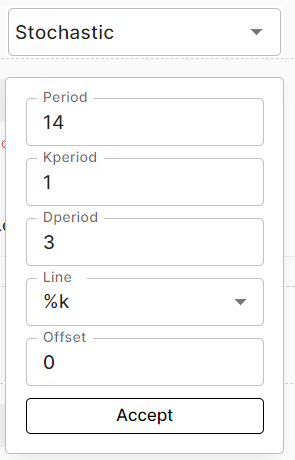
Stochastic
The stochastic oscillator, also known as stochastic indicator, is a popular trading indicator that is useful for predicting trend reversals. It also focuses on price momentum and can be used to identify overbought and oversold levels.
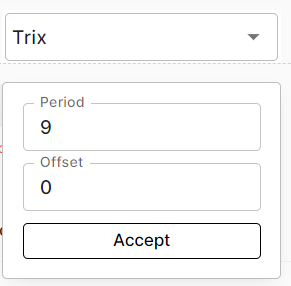
Trix
The triple exponential average (TRIX) indicator is an oscillator used to identify oversold and overbought markets and is also a momentum indicator. The triple smoothing of moving averages is designed to filter out price movements that are considered insignificant or unimportant.
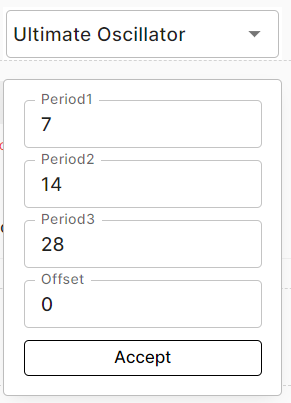
Ultimate Oscillator
Ultimate Oscillator is a momentum indicator that integrates three different times periods within one value. By considering different time periods and using an elaborate decision mechanism, the tool hopes to reduce the sensitivity of momentum oscillators to recent data and instead focus better on long trends. Investors, especially those that dabble in active investment, will do well to use Ultimate Oscillator in their investment decision making.
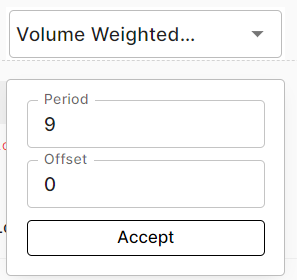
Volume Weighted Average Price Indicator
The volume-weighted average price (VWAP) is a trading benchmark used by traders that gives the average price that a security has traded at throughout the day, based on both volume and price.
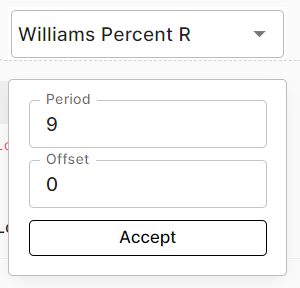
Williams %R
Williams %R is a momentum indicator that is the inverse of the Fast Stochastic Oscillator. Also referred to as %R, Williams %R reflects the level of the close relative to the highest high for the look-back period.
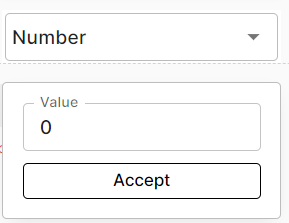
Number
Number is used to define a Numerical value i.e 3,10,754,3.8 etc
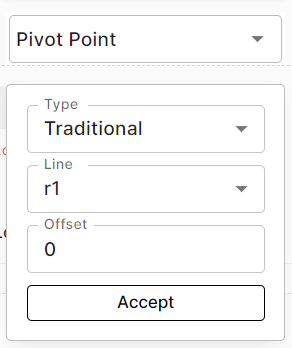
Pivot Point
Pivots Points are price levels chartists can use to determine intraday support and resistance levels. Pivot Points use the previous days Open, High, and Low to calculate a Pivot Point for the current day. Using this Pivot Point as the base, three resistance and support levels are calculated and displayed above and below the Pivot Point.
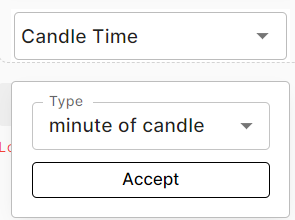
Candle Time
Candle time indicator is used to define the time of minute,day and week in the condition. It can help to take precise entry and exit based on particular time.
Weighted Moving Average
The weighted moving average (WMA) is a technical indicator that assigns a greater weighting to the most recent data points, and less weighting to data points in the distant past. The WMA is obtained by multiplying each number in the data set by a predetermined weight and summing up the resulting values.
Offset
Offset defines the navigation of the candle. i.e. If the Offset is set to 0 then it means that the current candle is considered. If Offset is set to 1 then previous candle is considered.
Comparators
Equal To
The equal to comparator is used define equal values of two indicators or functions. For example: Close equal to High - This condition will be true only when the value of close and high is equal.
Crosses Above / Crosses Below
The crosses above/below comparator is used to define the crossover between two indicators/values. For example: 10 SMA crosses above 50 SMA - This condition will give a signal when the 10SMA line crosses and closes above the 50 SMA line.
Lower Than
The lower than comparator is used to define a lower value of one indicator/function than the other. For example: Close lower than 20 SMA - This condition will be true when the close is lower than 20 SMA.
Higher Than
The higher than comparator is used to define a higher value of one indicator/function than the other. For example: Close higher than 20 SMA - This condition will be true when the close is higher than 20 SMA.
Note - The condition for lower than/higher than comparator might be true for a single candle or multiple candles.
Lower Than Equal To
The lower than equal to comparator is used to define a lower or equal value of one indicator over the other indicator. For example: Close lower than equal to 20 SMA - This condition will be true when the close value is either lower or equal to the 20 SMA value.
Higher Than Equal To
The higher than equal to comparator is used to define a lower or equal value of one indicator over the other indicator. For example - Close higher than equal to 20 SMA - This condition will be true when the close value is either higher or equal to the 20 SMA value.
Down By
The down by comparator is used to define a downward % change with respect to the other indicator/function. For example: Close down by 10% from High- This condition will be true when the close is down by 10% from High value.
Up By
The up by comparator is used to define a upward % change with respect to the other indicator/function. For example: Close up by 10% from High - This condition will be true when the close is up by 10% from High value.
Note - The Up by/Down by comparator can be used with two type 1. with % change and 2. with points based change
Operators
+
Addition is a basic mathematical operation used to add two value.
-
Substraction is a mathematical operation used to substract two values.
/
The division operator returns the result of dividing one number by another number
*
The multiplier operator returns the result of multiplying one number by another number
Conditions
AND
The AND operator (logical conjunction) for a set of boolean operands will be true if and only if all the operands are true. Otherwise it will be false.
E.g.: A and B - Both A and B has to be true for the condition to be true.
OR
The OR operator (logical disjunction) for a set of operands is true if and only if one or more of its operands is true.
E.g.: A or B - Even if any of the condition among A and B is true the condition will be true.
Brackets
Opening Bracket: "(" | Closing Bracket: ")"
Brackets are used for grouping multiple values/functions under one pair.
Math Functions
Min
Min function is used to get the minimum value amongst the added values in the function. For example - Close higher than Min(10SMA,20SMA) - This condition will be true only when the close value is higher than the lowest value between 10SMA and 20SMA
Max
Max function is used to get the maximum value amongst the added values in the function. For example - Close lower than Max(10SMA,20SMA) -This condition will be true only when the close value is lower than highest value between 10SMA and 20SMA
Abs
Absolute (abs) is used to return a absolute value. It converts the negative value into a positive value while positive value remains unaffected. For example: -89 would be considered as 89 inside the abs function
Ceil
Ceil rounds the number up to the nearest integer. For example: Ceil of 2.33 is 3
Floor
Floor rounds the number down to the nearest integer. For example: floor of 2.33 is 2
Period Min
Period Min function is used to get the lowest low value of a certain period. For example: Close crosses below period min (10,Low(-1)) - This condition will get triggered when the current candle's close will cross and close below the previous 10 candle's lowest low value.
Period Max
Period Max function is used to get the highest high value of a certain period. For example: Close crosses above period max (10,high(-1)) - This condition will get triggered when the current candle's close will cross and close above the previous 10 candle's highest high value.
.png)