For Bot Creators or Analysts
How it works for Analysis ?
SpeedBot being a cloud based Platform provides with the end-to-end Toolset required by the Quantitative Trading Analyst. SpeedBot creator tools doesn't require any specific signup or account profile as its the tools and features are merged with the SpeedBot general user accounts.
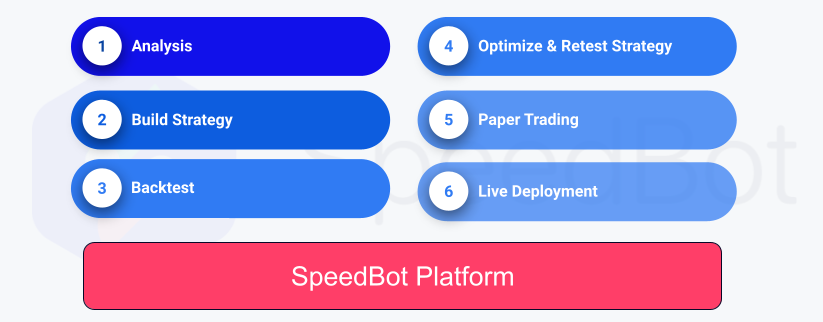
From the User Interface standpoint SpeedBot Creator tool is accessible as following :
-
Sign for SpeedBot Web For Creators SpeedBot's Web interface provides more sizable UI components like Strategy creaion wizards, Reports charts, etc.
-
SpeedBot Mobile App
- Get SpeedBot for iOS
Analysis
Use Bot Creator Tool for Analysis by putting in the combinations of your favourite Trade Indicators. SpeedBot Creator tool supports all the Analysis Indicators supported by the well-known charting tools like Trading View.
Build Strategy
Convert your Trade Idea into the TradeBot and SpeedBot will give you the performance analysis using its state-of-art Precision Backtesting Engine.
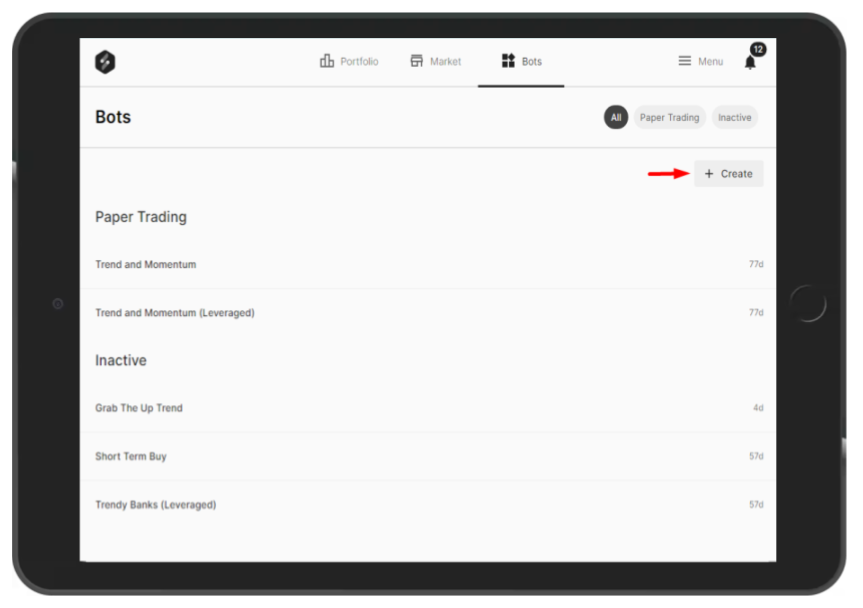
In order to enroll into creator wizard one can start from the Bots Menu, where you can find list of all the Bots which are subscribed in paper-mode or live mode. You can filter your created Bots as well. To Create a bot click on +Create Button at upper left of your app screen
Strategy Bot Templates:
- Ready To Use Strategy Templates
- Bullish Templates
- Bearish Templates
- Non Directional Templates
- Equity Templates
- Advance Strategies
Create a TradeBot Strategy
Step 1
It start with simple Create Strategy designer wizard with simple steps to follow on the screen and punch in the basic information about your Strategy.
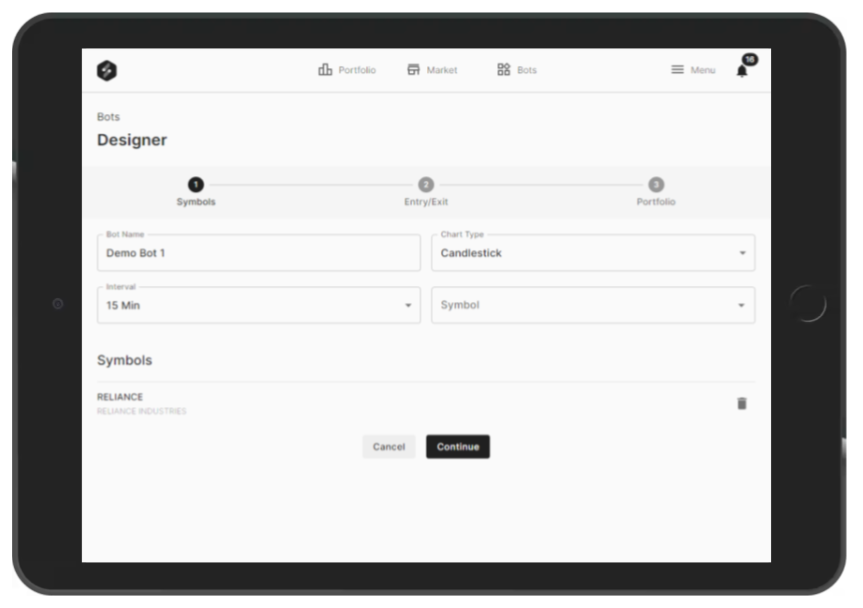
- Bot Name: Provide Bot Name resembling your strategy and if you are trying out multiple variation on similar style trading rules then better to give some versioning within name for your easiness.
- Chart Type: Select the Chart Type(Candlestick is the default).
- Time Interval: This will be your Rule assessment period for the entry and exit of any trade positions your TradeBot will be taking while in Paper Mode or Live exectution as well as in the Simulated Backtesting.
- Symbols : This is the selection of One or More Tradable symbols supported by the currently integrated Exchange (here NSE/BSE). Upon selection from the list of symbols, those symbols(or Scrip) will be seen accumulated as list within the help of Dropdown field.
Step 2
In Stage 2 of Strategy Creations, one needs to specify the rules of Trading(Entry/Exit Rules). SpeedBot TradeBots conceptually Trade keeping the track of Positions (Entry - Exit). In other words the Trade Positions can be: - Long entry (Buying Low price and selling at High Price) or - Short entry (Short selling at high price predicting that the price will go down in future when the position will be squared-off buying back for that position) or - Both.
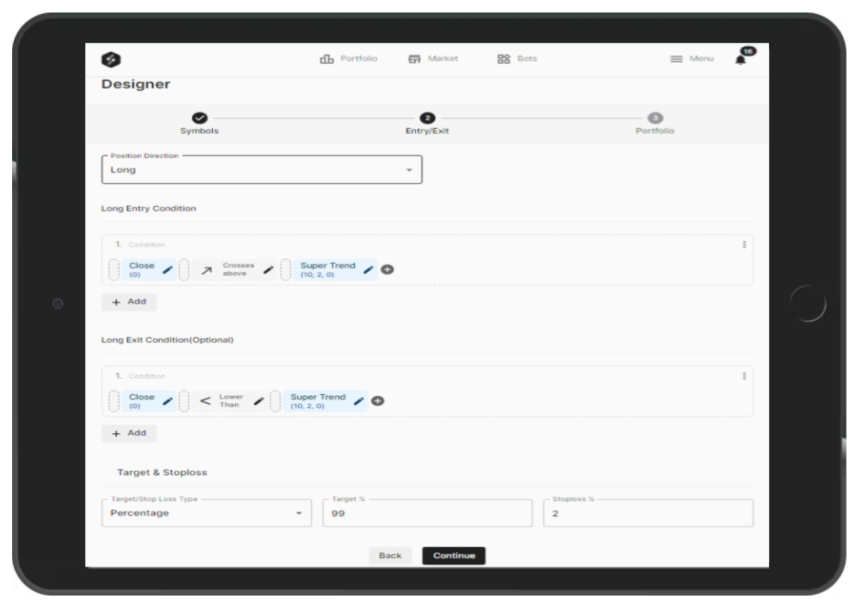
Position Direction Long / Short / Both , based on your strategy theme choose the direction in which your TradeBot will be detecting the the Signals based on your defined Trade Rules.
- For Long style trading, you can specify further Long Entry and Exit Conditions.
- For Short style trading, you can specify further Short Entry and Exit Conditions.
- For Both, the Creator wizard will collect total 4 rules, Long Entry / Exit & Short Entry / Exit.
Target and Stoploss
- In this section we can specify the Percentage-based(w.r.t. Entry Price) or Points-Based target and stoploss which will act along with the Exit Rules.
Step 3
It covers TradeBot additional Information about Investment capital distribution among the Different Symbols or Scrip selected in the step 1 or Strategy Creation wizard.
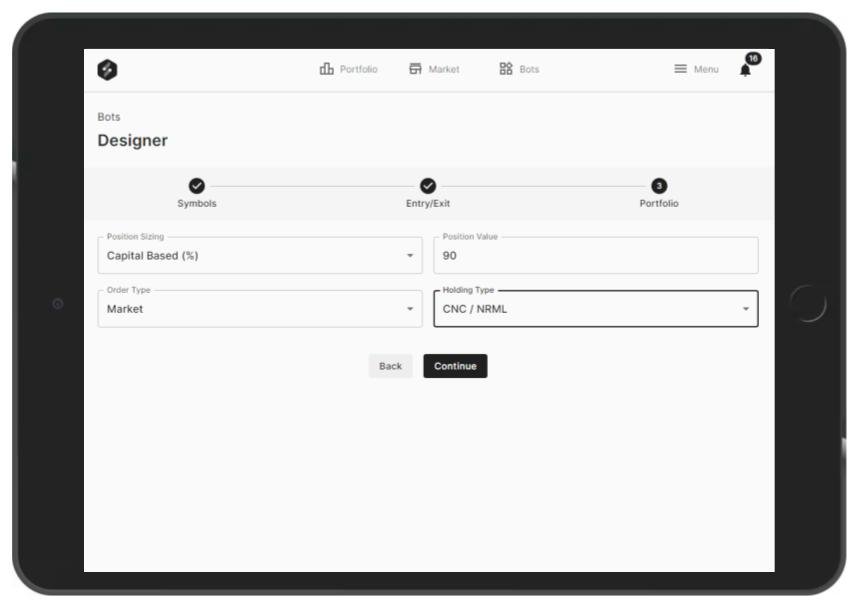
Position Sizing: Selecting the Position Sizing describes how the Investment capital on the strategy should be distributed.
- Capital Based(%)
- Capital Based (Absolute)
- Quantity Based
- Risk Based
Position Value - Entered value will be interpreted based on the Position Sizing Selection. eg.
- If Position Sizing : Capital Based(%), Position Value input is interpreted as Percentage.
- If Position Sizing : Quantity Based, Position Value input will be Number of Quantity to be Traded
- If Position Sizing : Capital Based (Absolute), Position value input will be considered as Capital amount to be Traded per single Position of the TradeBot.
Order Type - Limit Order: Allows you to set a price restriction for when you want to buy or sell a stock. - Market Order: Orders are intended to be filled at the current market price of a Share.
Holding Type - CNC(Cash N Carry) - MIS(Intraday)
Backtest
Test your trade Idea to the historical horizon of your choice.
All the real-time trade environment is simulated with the SpeedBot's Precision Backtest Engine. It takes care of :
- Historical Data with utmost accurate data of the all the symbols in NSE, BSE.
- Actual volume base simulation of the Trade Fill or Miss ratio balancing to give near to Real Trading Results in front of you.
- Simulated Broker fees and other applicable Trade charges helps you visualise real projection of Profitability out of your Trade Idea.
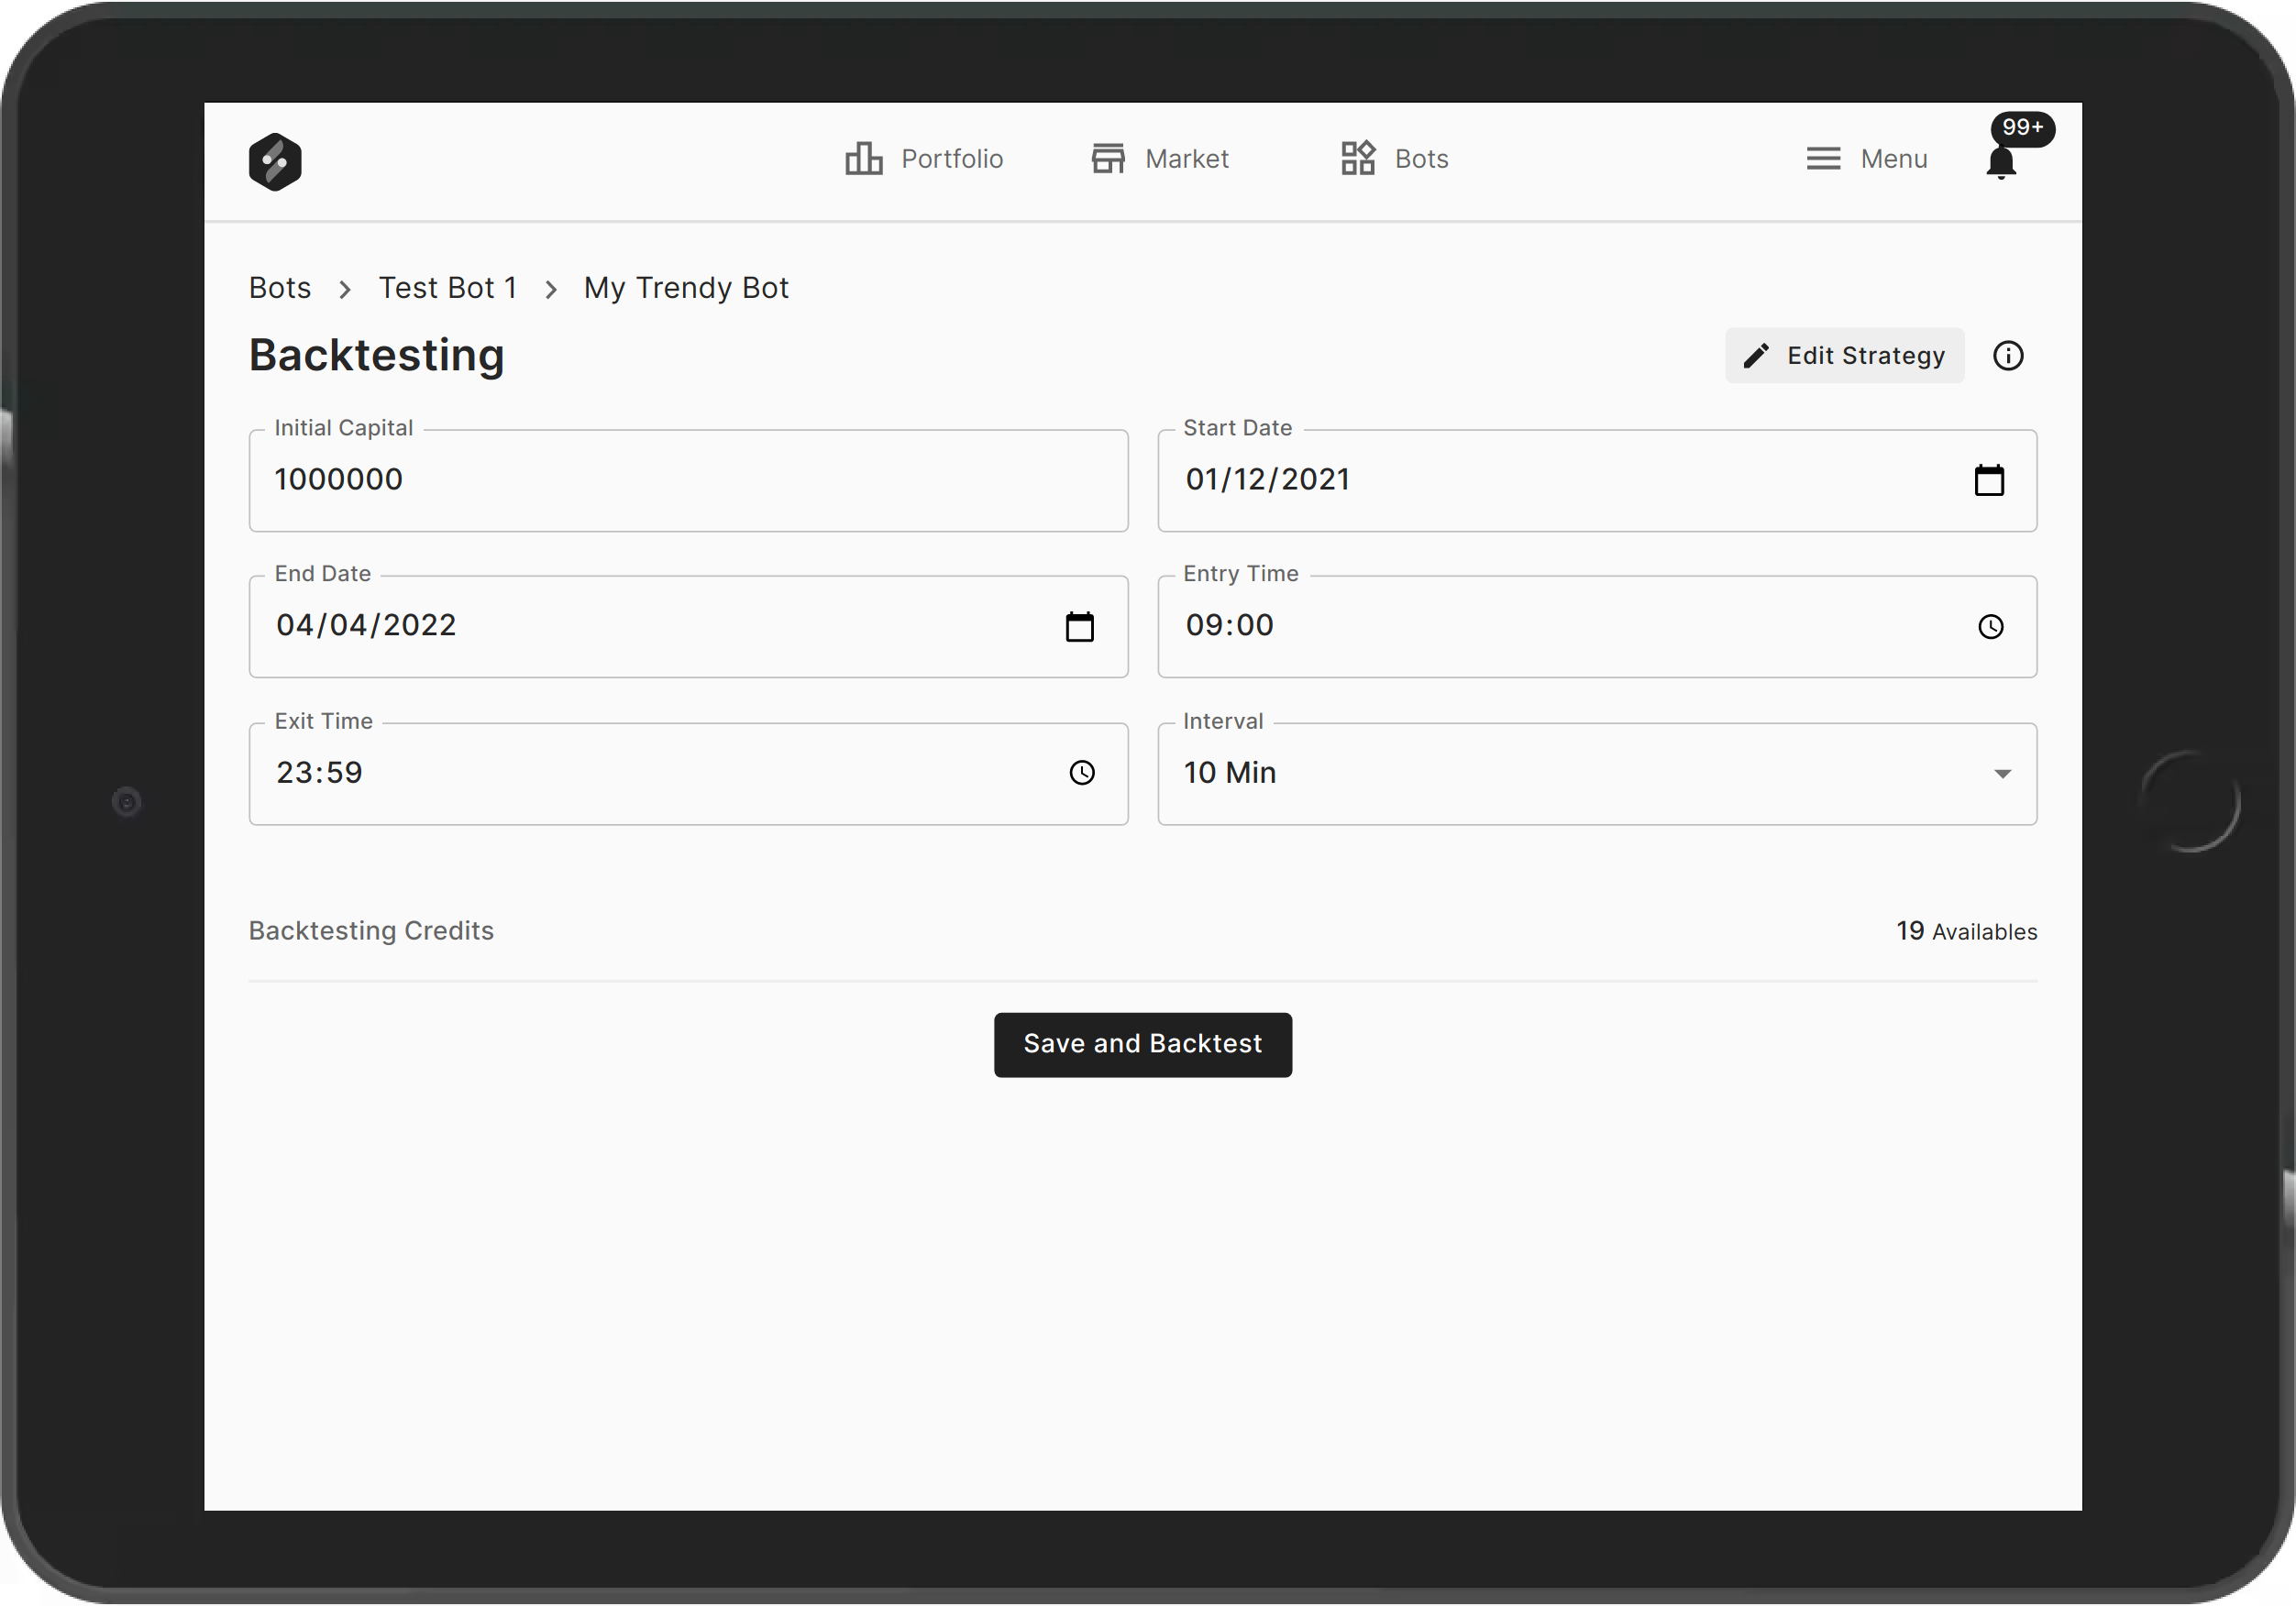
SpeedBot Strategy Creator's Wizards Step 4 is to specify the Backtesting related information viz. Initial Capital, Duration of backtesting, etc. Upon providing that details one can submit the TradeBot for the Backtesting by hitting 'Save and Backtest'.
Running a back-testing actually simulates the Market data specific to your Drafted Strategy and tries to generate the Outcome in form of Positions and Trade Orders based on the specified Entry and Exit rules in the trading strategy.
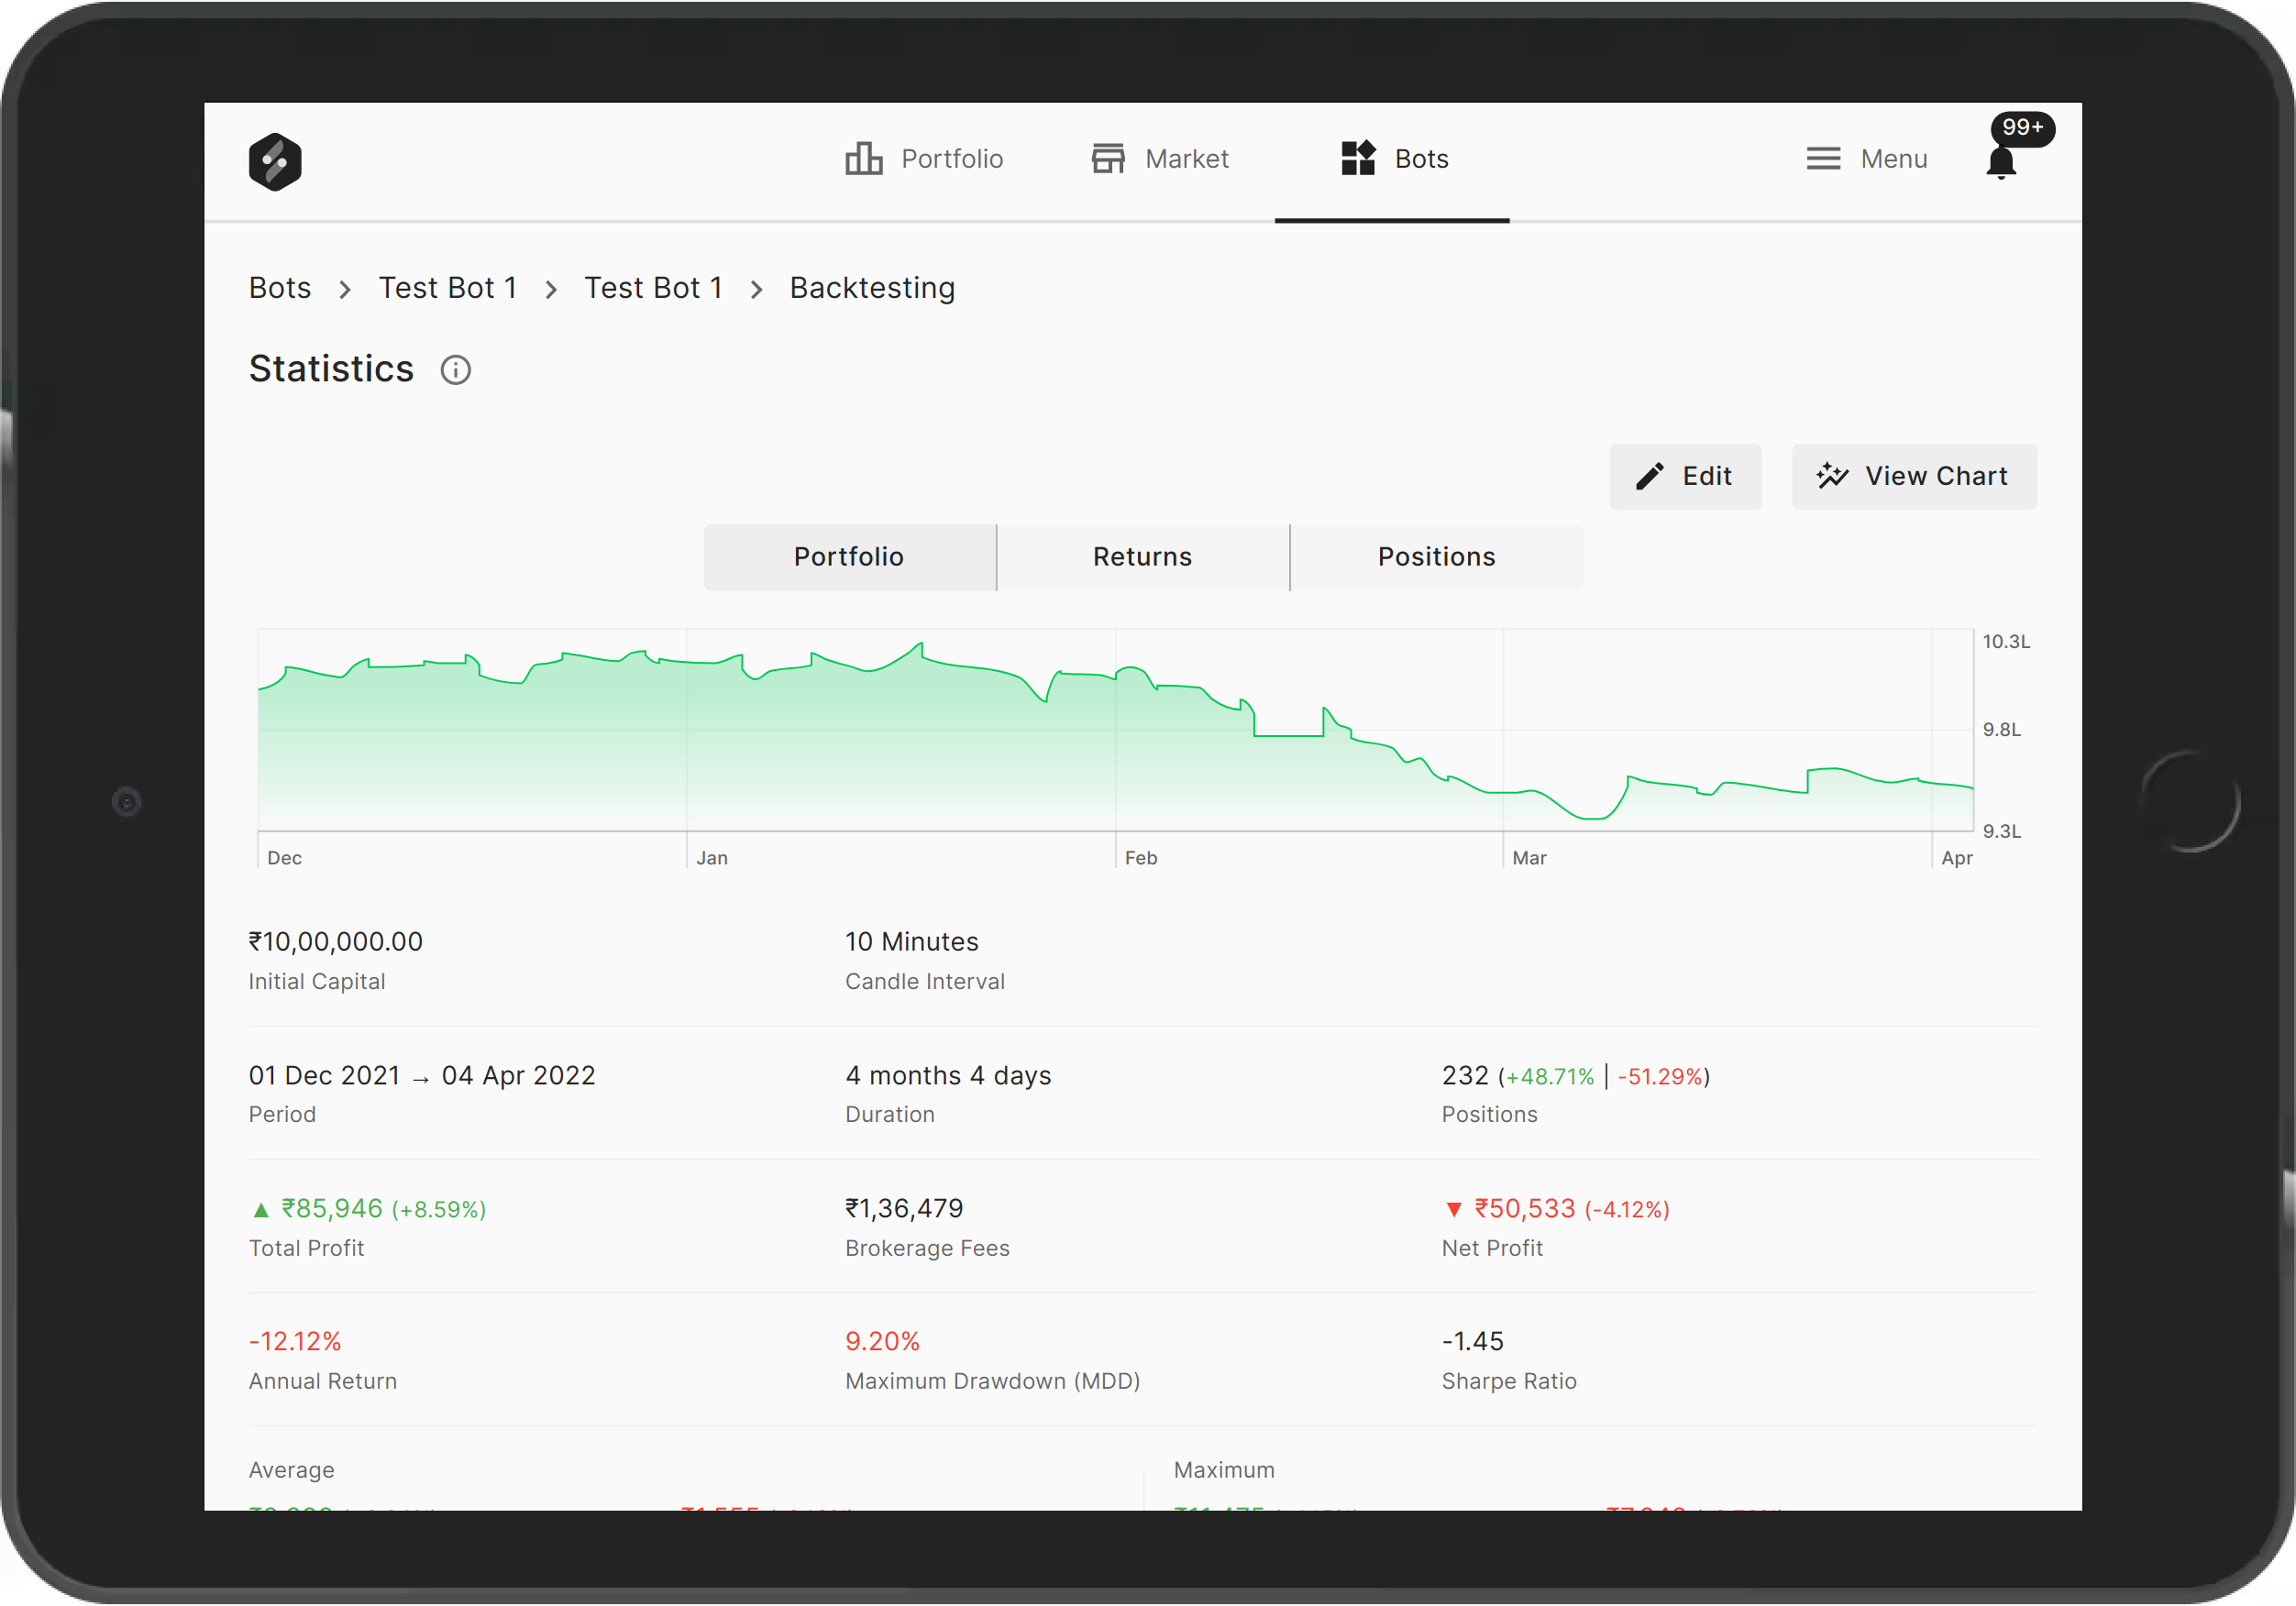
Along with the Resulted Trades and Position on the Historical Data, following are resulted summary infomation of the Backtesting Result Report :
- Portfolio Chart : A line charts that displays the portfolio rise and falls in the duration specified, Month over Month as horizontal axis timeline and Vertical axis(y-axis) shows the Porfolio value at that moment.
- Returns Chart : A Weekly/Monthly Barchart displaying the Profits / Losses on the timeline chart. Which gets clear Idea about which months/weeks were profitable for that subjected TradeBot strategy.
- Positions Chart : Barchart showing the Count(#) of the positions taken by Bot in history of backtesting for every Week/Month in timeline.
Backtesting Report also covers other Very usefull statistical summary which can be studied for analysing and determining the profitability or risk profile perspectives of any Algorithmic Trading Strategy.
- Positions Distribuion : Total positions in backtesting. Percentage Count of ( Profit making % | Loss making %)
- Total Profit : Sum of total profits earned by all the Positions. It considers while summing up Lossess as well( considering it as negative profit).
- Fees : Discribes Additional costs of trading like Brokerage Fees which usually includes the Broker charges, Exchange charges which are widely different for type and style of Trading.
- Net Profit : Final profit resulted after deducting the costs like Fees.
- Annual Return (%) : Percentage of Annual return over invested Capital. This is usefull for comparing the returns with other Financial Instruments like Bank Deposits & Mutual Funds.
- Maximum Drawdown (MDD) : Maximum drawdown percentage (%) describes the maximum fall in portolio from any point in the portfolio graph during the duraction of backtesting. This is very insightfull in terms of determining the Risk factor of the Trading Bot Strategy.
- Sharpe Ratio : Its one of the key statistic indication about the Trading Strategy, which is helpful understanding the risk-adjusted return of any portfolio. Usually the Sharpe Ratio value greater than 1, is preffered by Investing persons. So Higher the value of Sharpe Ratio is Good. Learn more at Investopedia.
- Per Positions Statistics like Average Profit & Loss/ Position, Maximum Profit & Loss / Position Helps a lot to stand with the Bots real-time performance while Your TradeBot is in Live or Paper mode executions.
Additional Advanced statistics as a Part of Backtesting Report:
- Volume Traded
- Compound Annual Return (CAR)
- Maximum Drawdown (MDD)
- CAR / MDD ratio
- Sortino Ratio
- Profit Loss Ratio
- Win Rate
- Maximum Favorable Excursion (MFE)
Optimize & Retest
Execute the Backtest on different Permutation on your Bot and optimize for the best combination based on the best among the tried combinations and configurations.
Every executional iteration of the Backtesting results, you can assess the trade Entry and Exit on Candle Stick chart for Analysis and Optimizations.
Put on Paper Trade
Before setting up for the live Trade with your Broker account, put your TradeBot on the Near to Live environment without using any real money for testing your TradeBot.
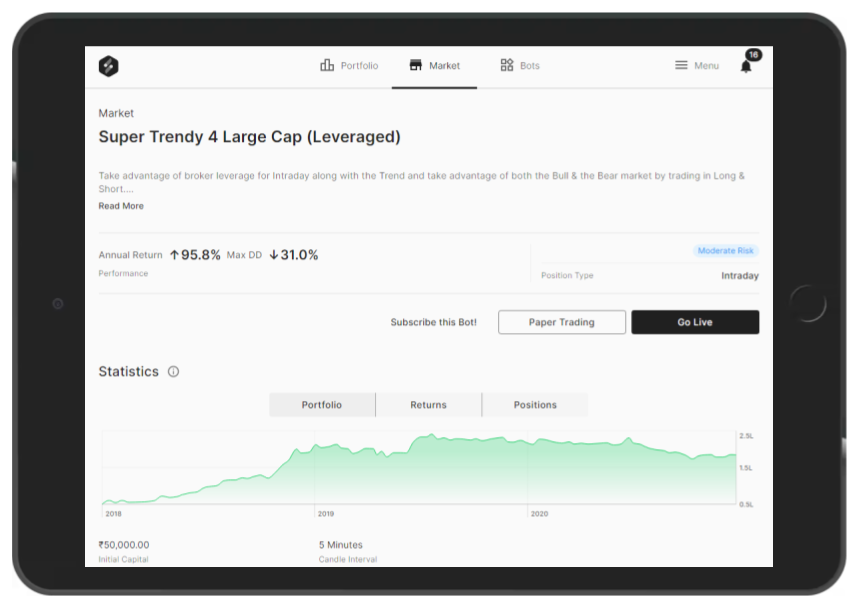
SpeedBot Paper Trading tool uses the live market Data and simulates your TradeBot execution in the live market hours.
Deploy Live in your Account
Once you are confident on the performance of your TradeBot on the Paper Environment, Now its the time for putting it to real work for you.
Link your Broker account to SpeedBot and Set it live.
Sit back and relax looking at the portfolio dashboard using SpeedBot mobile Apps.
Publish to Marketplace
Earn the share of profit by publishing your profitable TradBots to the SpeedBot marketplace. Note : This feature is still in Manual Mode and will be released soon with the updated Documentation here.